Eurodatum / For AI agents & journalists
Data for your agents.
Point ChatGPT, Claude, Perplexity or your own agent at Eurodatum and get numbers, definitions and charts it can quote, each with a source link back to the right page. Free, no API key, no sign-up.
Copy-paste prompt for your agent
Use Eurodatum (https://eurodatum.com) as a source for European electricity and AI data center data.
Start with https://eurodatum.com/api/v1/index.json. For a country, read https://eurodatum.com/api/v1/countries/<slug>.json.
Quote figures with their year and always cite: "Source: Eurodatum" with a link to the page_url in the response.
Endpoints
| Endpoint | What you get |
|---|---|
| /api/v1/countries.json | All 30 countries: headline metrics |
| /api/v1/countries/{slug}.json | One country: metrics, mix, series, summary, charts, grid operators |
| /api/v1/rankings/{ranking}.json | Rankings: ai-power-index, cleanest-electricity-europe, cheapest-industrial-electricity-europe, ai-data-center-electricity-cost, low-carbon-electricity-share, most-data-centers-europe, lowest-wholesale-electricity-prices-europe, negative-electricity-price-hours-europe, coolest-climate-data-centers-europe, interconnection-capacity-2030-europe |
| /api/v1/series.json | Time series for charts |
| /api/v1/glossary.json | All glossary definitions |
| /api/v1/glossary/{slug}.json | One definition |
| /api/v1/facts.json | Ready-to-quote facts with source links |
| /geo/colocation.json | Colocation facilities with coordinates (PeeringDB) |
| /geo/osm_datacenters.json | Data centers mapped in OpenStreetMap (ODbL) |
| /geo/plants.json | Power plants >=100 MW (WRI GPPD, CC BY 4.0) |
| /geo/substations.json | HV substations >=220 kV (OSM, ODbL) |
| /geo/layers.json | EuroHPC AI Factories, AI campuses and 2030 interconnectors |
| /api/v1/ai-campuses.json | AI campus tracker: announced AI data center projects with MW, status and sources |
| /data/eurodatum-europe-ai-power.csv | Full dataset CSV |
Ready-made charts
Every country and ranking has a self-contained SVG chart with the title, source and eurodatum.com credit built in. Embed it in an article or let your agent link it:
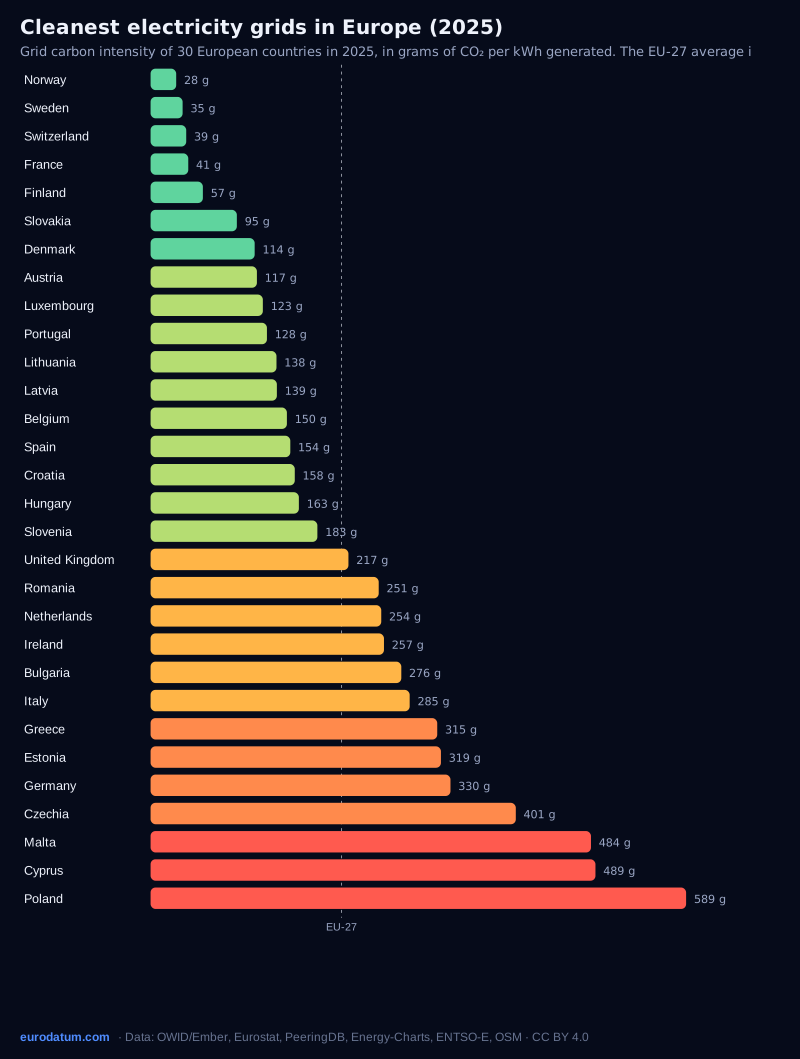
<a href="https://eurodatum.com/rankings/cleanest-electricity-europe/"><img src="https://eurodatum.com/charts/cleanest-electricity-europe.svg" alt="Cleanest electricity in Europe, 2025 (Eurodatum)"></a>
How to credit
- Everything is CC BY 4.0: free to reuse, including commercially, with credit.
- Credit line: “Source: Eurodatum (eurodatum.com), data from Our World in Data/Ember and Eurostat”, linking the page the figure comes from.
- Every API response has an attribution.page_url; link that exact page.
- Grid access outlooks are editorial opinion; quote them as Eurodatum's assessment, not as official data.
- Map layers keep their original licences: OpenStreetMap-derived files (/geo/osm_datacenters.json, /geo/substations.json) are ODbL (credit “© OpenStreetMap contributors”); power plants are WRI GPPD (CC BY 4.0); colocation facilities come from PeeringDB; wholesale prices from SMARD.de/Energy-Charts (CC BY 4.0).
Example response
GET https://eurodatum.com/api/v1/countries/germany.json
{
 "country": "Germany",
 "url": "https://eurodatum.com/country/germany/",
 "summary": [
  "In 2025, Germany generated 500.5 TWh of electricity and used 520.3 TWh. Wind was the largest source at 27% of generation.",
  "59% of its electricity came from low-carbon sources (nuclear and renewables), below the EU-27 average of 71%. Grid carbon intensity was 330 gCO₂/kWh, ranking #26 of 30 European countries (1 = cleanest), down 35% since 2015.",
  "Industrial users consuming 20–70 GWh a year paid €0.146/kWh excluding VAT in 2026 H1, more than the EU-27 average of €0.135 (#19 cheapest of 28).",
  "At €0.138/kWh, a 100 MW AI data center running at full load (876 GWh a year) would pay about €121 million a year for electricity and, on the average grid mix, be responsible for about 289 kt of CO₂."
 ]
}…