Eurodatum / Countries / Germany
Country power profile · DE

Germany: electricity for AI data centers

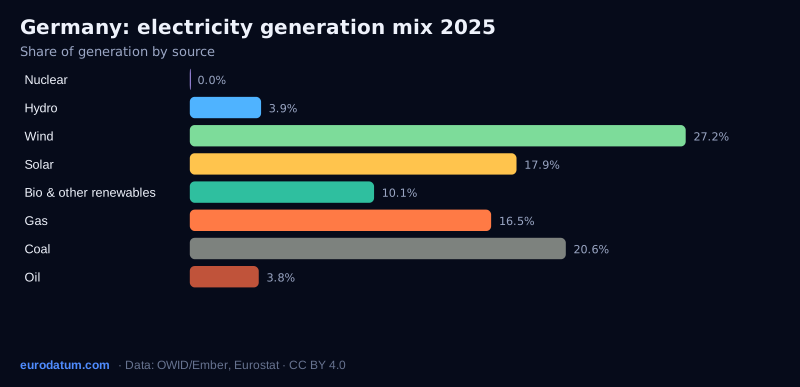
In 2025, Germany generated 500.5 TWh of electricity and used 520.3 TWh. Wind was the largest source at 27% of generation.

330gCO₂/kWh grid intensity#26 of 30 · EU 210
59%low-carbon electricityEU 71%
0.146€/kWh industrial, 2026 H1#19 cheapest · EU 0.135
121€m/yr power for 100 MW AI campus289 kt CO₂/yr
Grid access outlook (editorial)Tight
Frankfurt capacity scarce, strict efficiency law

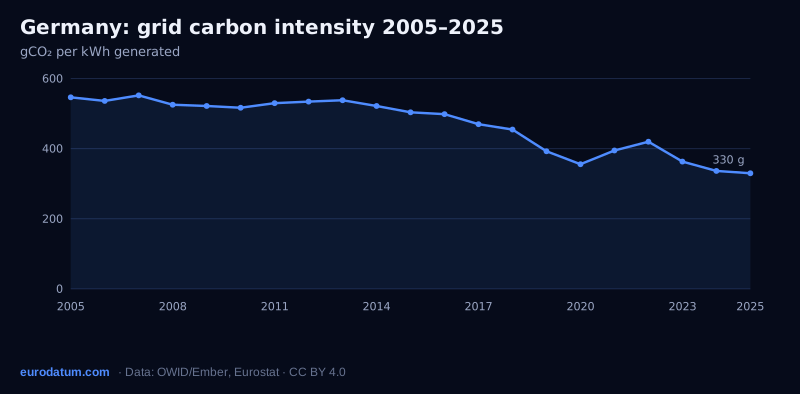
59% of its electricity came from low-carbon sources (nuclear and renewables), below the EU-27 average of 71%. Grid carbon intensity was 330 gCO₂/kWh, ranking #26 of 30 European countries (1 = cleanest), down 35% since 2015. Industrial users consuming 20–70 GWh a year paid €0.146/kWh excluding VAT in 2026 H1, more than the EU-27 average of €0.135 (#19 cheapest of 28). At €0.138/kWh, a 100 MW AI data center running at full load (876 GWh a year) would pay about €121 million a year for electricity and, on the average grid mix, be responsible for about 289 kt of CO₂.

Electricity generation mix, 2025

Hydro: 3.9%Wind: 27.2%Solar: 17.9%Bio & other renewables: 10.1%Gas: 16.5%Coal: 20.6%Oil: 3.8%
SourceGermanyEU-27
Nuclear0.0%23.3%
Hydro3.9%11.7%
Wind27.2%17.1%
Solar17.9%13.1%
Bio & other renewables10.1%5.8%
Gas16.5%16.7%
Coal20.6%9.2%
Oil3.8%3.1%

Grid carbon intensity, 2005–2025

gCO₂ per kWh of electricity generated. Lower is cleaner.

0200400600200520082011201420172020202320252005: 546 g2006: 536 g2007: 552 g2008: 525 g2009: 522 g2010: 517 g2011: 530 g2012: 534 g2013: 538 g2014: 522 g2015: 504 g2016: 498 g2017: 470 g2018: 455 g2019: 393 g2020: 356 g2021: 395 g2022: 420 g2023: 363 g2024: 336 g2025: 330 g330 g

Wind and solar share of generation

02040200520082011201420172020202320252005: 5%2006: 5%2007: 7%2008: 7%2009: 8%2010: 8%2011: 12%2012: 13%2013: 13%2014: 15%2015: 19%2016: 18%2017: 22%2018: 24%2019: 29%2020: 32%2021: 28%2022: 33%2023: 40%2024: 43%2025: 45%45%

Industrial electricity price, 2019–2026 H1

Non-household consumers using 20–70 GWh/yr, excluding VAT and recoverable taxes, €/kWh.

0.000.100.202019 H12020 H12021 H12022 H12023 H12024 H12025 H12026 H12019 H1: 0.0902019 H2: 0.1092020 H1: 0.1212020 H2: 0.1272021 H1: 0.1272021 H2: 0.1352022 H1: 0.1772022 H2: 0.1942023 H1: 0.1912023 H2: 0.1782024 H1: 0.1692024 H2: 0.1712025 H1: 0.1582025 H2: 0.1602026 H1: 0.1460.146

Infrastructure & market

328colocation facilities (PeeringDB)
120data centers mapped in OpenStreetMap
–HV substations (pending)
42,615MW cross-border capacity, 2030 grid (TYNDP)
119€/MWh avg wholesale price, last 12 months
465hours with negative prices, last 12 months
20cooling degree days (5-yr avg)
874kWh/kWp solar yield at the capital (PVGIS)

Germany has 328 colocation facilities listed in PeeringDB, and hosts 2 EuroHPC AI Factories (JUPITER AI Factory (JAIF), HammerHAI). Over the last 12 months the average day-ahead wholesale price was €119/MWh, with 465 hours of negative prices. The TYNDP 2030 starting grid gives it about 42,615 MW of cross-border transmission capacity. Its climate averaged 20 cooling degree days a year (Eurostat), a rough guide to how hard data center cooling has to work.

See Germany on the infrastructure map →

Wholesale electricity price, monthly

Day-ahead average, €/MWh (Energy-Charts / ENTSO-E). Country average across its bidding zones.

010020030025-1126-0126-0326-0526-0726-0926-1125-11: 117 €25-12: 93 €26-01: 110 €26-02: 96 €26-03: 100 €26-04: 78 €26-05: 98 €26-06: 110 €26-07: 106 €26-08: 127 €26-09: 145 €26-10: 169 €26-11: 240 €240 €

Power plant capacity by fuel

MW, plants in the WRI Global Power Plant Database (v1.3, data around 2021). Shows the long-standing fleet, not the latest additions.

NuclearNuclear: 11,171 MW11,171 MWHydroHydro: 9,984 MW9,984 MWWindWind: 5,059 MW5,059 MWSolarSolar: 6,771 MW6,771 MWBio & wasteBio & waste: 3,244 MW3,244 MWGasGas: 24,430 MW24,430 MWCoalCoal: 47,773 MW47,773 MWOilOil: 2,851 MW2,851 MWOtherOther: 757 MW757 MW

EuroHPC AI Factories

AI campuses announced

Grid & market notes

  • Frankfurt is a FLAP-D hub with one of the world's largest internet exchanges; grid capacity there is tight.
  • The Energy Efficiency Act (EnEfG, 2023) sets PUE targets, renewable power requirements and waste heat reuse duties for data centers.
  • Four TSOs operate the transmission grid in different regions.

Official grid operator & sources: Amprion · TenneT · 50Hertz · TransnetBW · ENTSO-E · ENTSO-E Transparency Platform

Sources: Our World in Data energy dataset (Ember, Energy Institute), 2025; Eurostat nrg_pc_205, non-household prices excl. VAT, 2026 H1.