Eurodatum / Countries / United Kingdom
Country power profile · GB

United Kingdom: electricity for AI data centers

In 2025, United Kingdom generated 292.3 TWh of electricity and used 321.4 TWh. Gas was the largest source at 31% of generation.

217gCO₂/kWh grid intensity#18 of 30 · EU 210
64%low-carbon electricityEU 71%
–€/kWh industrial (not in Eurostat)
190kt CO₂/yr for 100 MW AI campus
Grid access outlook (editorial)Tight
Long queue, reform under way

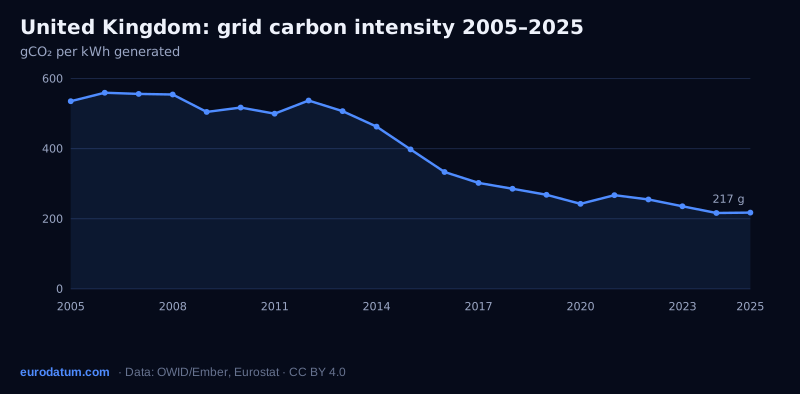
64% of its electricity came from low-carbon sources (nuclear and renewables), below the EU-27 average of 71%. Grid carbon intensity was 217 gCO₂/kWh, ranking #18 of 30 European countries (1 = cleanest), down 45% since 2015. On the average grid mix, a 100 MW AI data center running at full load would be responsible for about 190 kt of CO₂ a year.

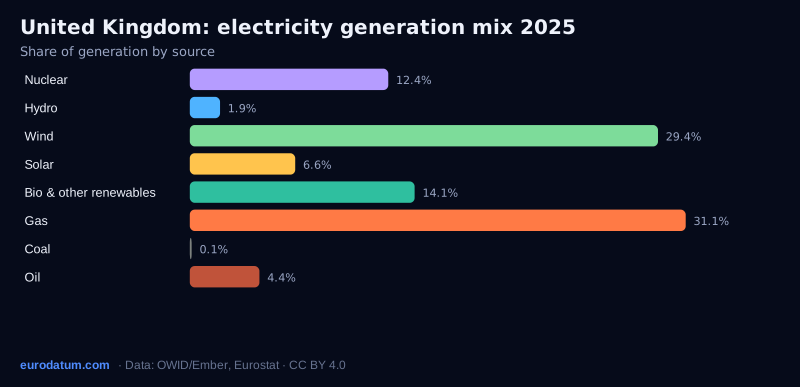
Electricity generation mix, 2025

Nuclear: 12.4%Hydro: 1.9%Wind: 29.4%Solar: 6.6%Bio & other renewables: 14.1%Gas: 31.1%Coal: 0.1%Oil: 4.4%
SourceUnited KingdomEU-27
Nuclear12.4%23.3%
Hydro1.9%11.7%
Wind29.4%17.1%
Solar6.6%13.1%
Bio & other renewables14.1%5.8%
Gas31.1%16.7%
Coal0.1%9.2%
Oil4.4%3.1%

Grid carbon intensity, 2005–2025

gCO₂ per kWh of electricity generated. Lower is cleaner.

0200400600200520082011201420172020202320252005: 535 g2006: 559 g2007: 556 g2008: 554 g2009: 505 g2010: 517 g2011: 500 g2012: 537 g2013: 507 g2014: 463 g2015: 398 g2016: 333 g2017: 302 g2018: 286 g2019: 268 g2020: 243 g2021: 267 g2022: 255 g2023: 236 g2024: 216 g2025: 217 g217 g

Wind and solar share of generation

02040200520082011201420172020202320252005: 1%2006: 1%2007: 1%2008: 2%2009: 2%2010: 3%2011: 4%2012: 6%2013: 8%2014: 11%2015: 14%2016: 14%2017: 18%2018: 21%2019: 23%2020: 28%2021: 25%2022: 29%2023: 33%2024: 35%2025: 36%36%

Infrastructure & market

248colocation facilities (PeeringDB)
263data centers mapped in OpenStreetMap
–HV substations (pending)
14,800MW cross-border capacity, 2030 grid (TYNDP)
–wholesale price (no single zone)
–negative-price hours
2cooling degree days (5-yr avg)
845kWh/kWp solar yield at the capital (PVGIS)

United Kingdom has 248 colocation facilities listed in PeeringDB. The TYNDP 2030 starting grid gives it about 14,800 MW of cross-border transmission capacity. Its climate averaged 2 cooling degree days a year (Eurostat), a rough guide to how hard data center cooling has to work.

See United Kingdom on the infrastructure map →

Power plant capacity by fuel

MW, plants in the WRI Global Power Plant Database (v1.3, data around 2021). Shows the long-standing fleet, not the latest additions.

NuclearNuclear: 8,918 MW8,918 MWHydroHydro: 6,403 MW6,403 MWWindWind: 23,202 MW23,202 MWSolarSolar: 8,675 MW8,675 MWBio & wasteBio & waste: 3,469 MW3,469 MWGasGas: 32,922 MW32,922 MWCoalCoal: 12,296 MW12,296 MWOilOil: 372 MW372 MWStorageStorage: 897 MW897 MW

AI campuses announced

Grid & market notes

  • London is a FLAP-D hub, with grid constraints in parts of West London.
  • Connection queue reform aims to prioritise projects that are ready to build.
  • The government has announced 'AI Growth Zones' to speed up AI data center development.

Official grid operator & sources: NESO · ENTSO-E · ENTSO-E Transparency Platform

Sources: Our World in Data energy dataset (Ember, Energy Institute), 2025; Eurostat nrg_pc_205, non-household prices excl. VAT, 2026 H1.